(주) 한화
SUSTAINABILITY
Hanwha Corporation is growing faster than ever as a global company now, with endless innovations and growth in both business and technology. We proudly introduce you to the present and the future of Hanwha corporation, which continues our journey towards a more sustainable future.
SHE Management System
SHE Policy
Hanwha Global is committed to a sustainable future through the establishment, implementation, and active enhancement of the SHE management system.
-
1. Make Safety, Health, Environment our Priority
Prioritizing the safety, health, and environment of employees, contractors, customers, and the local community, among other stakeholders, and all employees are responsible for practicing these value. -
2. Realizing a Self-regulation Culture with Regulatory Compliance
Realizing the internalization of self-regulation grounded in safety, health, and environmental compliance, across all organizational activities, including manufacturing, trade, and research and development. -
3. Contribute to Climate Crisis Response and a Sustainable Future
Striving for business growth in harmony with the environment through carbon neutrality, resource recycling, biodiversity conservation, improved pollutant emissions, and the provision of eco-friendly solutions. -
4. Securing SHE Capabilities and Management System Advancement
Ensuring that all employees and contractors acquire the necessary capabilities for SHE management and build a leading SHE management system through continuous improvement. -
5. Achieve Social Responsibility and Ensure Transparency
Upholding our social responsibility to achieve mutual growth with stakeholders, we transparently disclose our SHE management performance and communicate with them
SHE Policy
Hanwha Corporation/E&C does its best to establish a culture that prioritizes Safety, Health and Environment for the values of human respect and environmental protection.
-
1. Safety, Health and Environment priority management
The management takes initiative by leading the voluntary participation and active practice of all employees, subcontractors, and workers by setting the Safety, Health and Environment as the top priority. -
2. Compliance with Safety, Health and Environment laws
All executives and employees shall ensure a safe and clean working environment in compliance with the relevant laws and regulations, and actively participate in environmental activities of the local community to do their best in corporate social responsibility. -
3. Communication with stakeholders including workers
We ensure that workers can participate and discuss Safety, Health and Environment and communicate openly with stakeholders based on honesty and transparency. -
4. Continuous improvement of business processes
We regularly inspect the Safety, Health and Environment work process and continuously improve it. -
5. Pollution prevention and environmental protection
We strive to develop eco-friendly technologies and products to minimize emissions of greenhouse gases and pollutants.
MISSION
Safe and Healthy life to Everyone, Everywhere!
Beneficial to our Environment and Stakeholders!
VISION
2030 GROUP
ESH LIGHTHOUSE COMPANY
2035 GLOBAL
ESH LIGHTHOUSE COMPANY
Strategic Direction
- Internalization Safety Culture
- Advancement Management
- Proactive response to climate change
- Strengthen Retention capacity
- Improve ESG management
Emissions Trading System Implementation
Since being designated as a target company in June 2012 under the Framework Act on Carbon Neutrality and Green Growth for Coping with Climate Crisis, Corporation has meticulously managed greenhouse gas emissions from all its business sites. Starting from the first planning period (2015-2017), the Onsan plant was designated as an allocated facility and participated in the emissions trading system. In the third planning period (2021-2025), this scope was expanded to include all business sites. In 2023, Corporation optimized carbon credit purchases through regular market analysis and price monitoring conducted by a dedicated team. The company established and operated an emissions trading strategy through competitive trading, carry-over, borrowing, buying, and selling of carbon credits.
Greenhouse Gas Reduction Activities
Since 2007, the Onsan plant has been operating the N₂O Reduction Project, which was certified as a Clean Development Mechanism (CDM) project. This project removes N₂O, a greenhouse gas, from the nitric acid manufacturing process, thereby reducing approximately 250,000 tCO₂-eq annually and securing corresponding carbon credits. In 2023, in alignment with the Paris Agreement, Hanwha Corporation began transitioning the CDM project to the Sustainable Development Mechanism (SDM) project. The Global Division is planning to voluntarily install N₂O reduction facilities for the new nitric acid process under construction in Yeosu to redouble its commitment to greenhouse gas reduction.
Greenhouse Gas Reduction Activities
Hanwha Corporation’s Global Division pursues Operation Excellence (OE) activities across all business departments to improve energy efficiency and increase productivity. As part of the OE initiatives, the company identifies and manages items related to energy efficiency and greenhouse gas reduction and analyzes the effects of their implementation. In 2023, through OE activities at the Boeun and Onsan plants, 11 items were identified to improve energy efficiency and reduce power and fuel consumption, such as the installation of inverters and changes in operating methods. At the Onsan plant, waste heat energy from the nitric acid manufacturing process was converted into steam energy and used in the production process, resulting in a significant saving of energy. Using steam produced from waste heat, which has zero greenhouse gas emissions, has greatly contributed to reducing net greenhouse gas emissions at the Onsan plant. In 2023, selling of 135 TJ of residual steam energy also generated economic benefits. Furthermore, energy loss was prevented by controlling the operating temperature of heating and cooling systems, eliminating steam waste factors, and replacing lighting with high-efficiency LED lights to consistently improve energy efficiency within the plant. The E&C Division is making efforts to improve energy efficiency by attaching timers to temporary distribution boxes that use temporary electricity to ensure that electricity is not used outside of working hours. The division is also enhancing insulation performance and installing LED/sensor lights in temporary offices and pathways to reduce energy consumption. In 2024, Hanwha Corporation plans to continue its energy efficiency activities and identify new energy-saving measures across its business sites.
COVID-19 Response and Prevention
2020 was a year of continued crises and difficulties due to the global outbreak of COVID-19. Hanwha Corporation established and implemented response strategies to overcome the pandemic quickly and systematically and to provide a safe and healthy environment for all employees and on-site personnel. In addition, we are striving to overcome the global pandemic hand in hand with our executives and employees as well as various stakeholders, including our suppliers and local communities, and lay the foundation for coexistence in a safe society.
| Establishment of an emergency response system |
|
|---|---|
| Infection prevention activities in the workplace |
|
| Support through provision of protective equipment |
|
| Support for symptomatic employees |
|
| Protection management at overseas plants |
|
| Support for a safe working environment |
|
| Support towards the safety and health of suppliers |
|
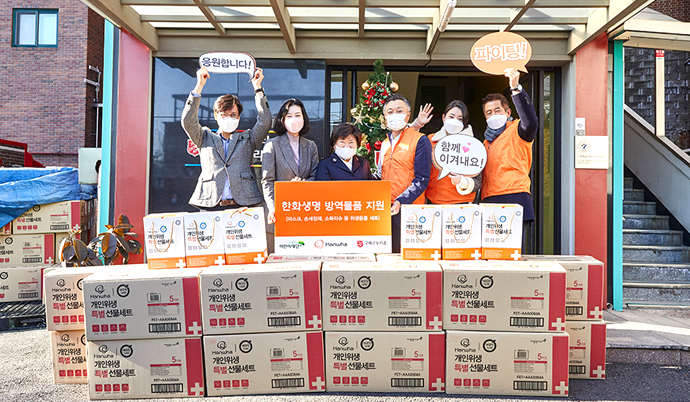
Support for the Safety and Health of the Local Community
Hanwha Corporation donated various hygiene products and protective equipment to safeguard the local community from the risk of COVID-19 infection and to promote the safety and health of the local community. In February 2020, we provided protective equipment, including 150,000 masks, for vulnerable populations and medical professionals in Daegu and Gyeongsangbuk-do where COVID-19 was rapidly spreading. In March 2020, we donated funds for overcoming COVID-19 to families of veterans, such as Persons of National Merit. During winter, when COVID-19 and influenza prevailed at the same time, we assumed our responsibility in securing the safety of the local community as a topmost priority in the face of social and economic crises by producing and delivering personal hygiene kits to 10,000 households from vulnerable populations.
Employee Health Promotion
Hanwha Corporation upholds maintaining the health and safety of all our employees as the root and primary principle for achieving our ESH management vision and operates a variety of health management and promotion programs for all our employees.
Employee Health Management Program
- Operation of health administration offices at each plant
- Assessment, analysis, and improvement actions of job stress factors
- Risk assessment and follow-up management of cerebrovascular disease
- Health checkups for all executives and employees and comprehensive health checkup reflecting individual needs for executives and employees aged 35 and older and their spouses
| Health Checkups in 2020 (Unit: persons) | ||
|---|---|---|
| Employee | Spouse | Total |
| 2,858 | 1,834 | 4,692 |
Employee Health Enhancement Program
- Exercise programs for executives and employees with high blood pressure, diabetes, dyslipidemia, urinalysis, and obesity
- Mental health promotion programs, such as smoking cessation and obesity clinics, alcohol treatment and rehabilitation programs, and nutrition improvement programs
- Check stress, depression, and alcohol dependence through a survey, select risk group subjects, and support individual counseling with an external professional counselor
Work Environment Management
Hanwha Corporation endeavors to protect our employees and workers from harmful factors and to provide a safe and pleasant work environment. For all harmful factors, we collect the MSDS and provide the information to our employees and closely monitor the health of staff who are exposed to specific harmful factors by conducting special checkups.
In addition, we measure and manage the work environment and exposure to harmful factors by establishing internal standards that are stronger than the legal standards in order to provide a safer working environment to our employees. Through these efforts, we achieved 'ZERO' Occupational Illness Frequency Rate(OIFR) in all our business divisions for the past three years.
Safety Climate Diagnosis and Evaluation
Hanwha Corporation has developed a Safety Climate measurement program to establish a more mature safety culture. We measure Hanwha Corporation’s overall Safety Climate level as well as strengths and weaknesses of each specific indicator and establish effective safety culture strategies that are optimized for our organization.
Implementation of ‘Safety Day’
Hanwha Corporation designates a cycle for each plant and implements a 'Safety Day' participated by all employees. On 'Safety Day', the plants share information on the importance of safety and raise awareness by suspending all production in the plants, sharing their on-site improvement activities, such as various safety-related education and training sessions, intensive inspection activities, and small group safety improvement meetings, sharing results and feedback, and concentrating only on safety and health activities.
Integrated Environmental Management System
The Global Division’s Onsan plant has established an autonomous site management system for the goal of complying with integrated environmental management standards. This system includes aligning the integrated environmental management plan with on-site conditions, constantly checking documents (e.g., emission logs), and conducting self-measurements. As a result of such efforts, Onsan Plant received an “Excellent” rating in all quantitative evaluation items during the Ministry of Environment’s regular inspection in 2023 and a subsequent extension of its inspection interval to three years. The Global Division aims to consistently enhance its autonomous management system to minimize the emission of environmental pollutants.
Air Pollutants Management
Hanwha Corporation operates its air pollutant emission and abatement facilities in compliance
with the Clean Air Conservation Act and the Act on the Integrated Control of Pollutant-Discharging Facilities.
To minimize emissions of air pollutants such as nitrogen oxides (NOx), sulfur oxides (SOx), and particulate matter
and maintain emission concentrations at less than 50% of legal standards, the company is consistently expanding
and improving its abatement facilities. Major emission outlets are equipped with tele-monitoring systems (TMS)
for real-time monitoring of pollutant concentrations. Furthermore,
the Onsan Plant has implemented a smart environmental management system by installing an
automated N₂O concentration measurement system to monitor N₂O reduction in real-time as a tie-in with its CDM project
(N₂O catalyst reduction project on nitric acid process).
The E&C Division has proactively contributed to improving air quality
and reducing air pollution by signing voluntary agreements with the Ministry of Environment in 2019 and Seoul
Metropolitan Government in 2022 to reduce high concentrations of fine dust.
For all processes that generate fugitive dust at construction sites, the division implements suppression measures in accordance with relevant laws,
restricts the use of outdated construction machinery, installs and operates detailed fine dust management IoT systems,
and adjusts and/or reduces construction times during emergency fine dust reduction periods.
Stricter internal management standards are also enforced, especially from February through April,
when the highest concentrations of fine dust occur. Consistent development of facilities and exemplary cases
(e.g., development of water spraying management systems, use of dust screens) have earned citations from the Minister of Land, Infrastructure,
and Transport, and the Minister of Environment.
Water Resources Management
The Global Division operates its water pollutant discharge and abatement facilities in compliance with the Water Environment Conservation Act and the Act on the Management of Facilities Causing Environmental Pollution. To manage the concentration of water pollutants (e.g., Total Organic Carbon (TOC), Biochemical Oxygen Demand (BOD), and Suspended Solids (SS) at levels below 50% of legal standards, it rigorously monitors the efficiency of its wastewater treatment facilities. The Onsan plant has changed its water quality management method for cooling tower reuse water, reducing blowdown water quantity, thereby achieving simultaneous decreases in water usage and wastewater generation. The E&C Division establishes management guidelines per sector to minimize water pollution that may occur during the construction process and operates retentionand device-based management facilities for the treatment of wastewater, sewage, and non-point source pollutants. Furthermore, it regularly monitors potential contamination through discharge water quality inspections. Hanwha Corporation will continue striving to reduce water usage and wastewater generation through the upgrading of water resource management technologies across its divisions.
Waste Management and Reduction
The Global Division strives to minimize waste from its business activities. Initiatives such as the waste emission identification system, tumbler campaign, and distribution of plants in recycled plastic pots encourage responsible waste disposal and recycling among employees. In 2023, it also contributed to reducing external waste by reusing plastic packaging for semi-finished products. The E&C Division monitors real-time waste processing through the national waste management system “Allbaro” and implements a waste target management system at construction sites. It takes meaningful and substantive steps toward waste reduction by developing waste management indicators, establishing reduction targets for all stages of construction, and reviewing progress on a monthly basis. In cases of underperformance, reasons for the shortfall and corrective measures are identified and implemented to achieve waste reduction goals.
Soil Resources Management
The Global Division manages soil contaminants and facilities subject to detailed soil contamination controls in compliance with the Soil Environment Conservation Act and the Act on the Integrated Control of Pollutant-Discharging Facilities. It conducts soil contamination tests in accordance with legal standards and performs regular inspections and maintenance of production and storage facilities to prevent soil contaminant leaks. Moreover, the E&C Division conducts soil contamination tests during construction before removing soil to ensure that soil contaminants do not seep out. In the event of soil contamination, the division carries out precise investigations and soil remediation in accordance with relevant laws.
Noise and Vibration Management
The E&C Division aims to minimize the inconvenience caused to local residents by the noise and vibration during construction. It monitors real-time noise levels through an IoT-based noise measurement system and implements a pre-diagnosis system to predict and mitigate potential noise impact to minimize any adverse effects.
Regulatory Compliance for Hazardous Chemicals
The Global Division has implemented a pre-evaluation system for chemicals to ensure
that all chemicals are reviewed for regulatory compliance before purchase,
and purchases of such chemicals can only be made with final approval.
This system is integrated with the procurement system to prevent purchase requests from being made if there is no pre-evaluation number.
In the event of a regulation amendment, the preevaluation number is automatically deactivated, requiring re-evaluation for environmental safety and health.
To consistently improve its pre-evaluation system, the division benchmarks internal and external best practices and continually assesses their effectiveness.
Furthermore, it monitors and reviews the handling of chemicals subject to the Act on Registration and Evaluation of Chemical Substances at least twice per year to ensure compliance.
With the upcoming registration deadline of Dec. 31, 2024, for existing chemicals produced or
imported in quantities of 100-1,000 tons per year, the Global Division is actively reviewing its chemical inventory
and has registered eight existing chemicals (as of Q2 2024).
Key Performance in Climate Change
-

- January 2024
- Joined K-RE100
-

- Climate Risk Scenario
- Conducted quantitative financial impact analysis
-

- 2023 CDP Climate Change
- Achieved A-
Key Performance in ESH Management
-

- For 6 consecutive years
- OIFR(Occupational Illness Frequency Rate) Zero
-

- Average Process Safety Management Grade achieved across all business sites
- Above S
-

- Integrated Environmental Management Plant (Onsan)
- "Excellent" Rating in Ministry of Environment's Regular inspection
-

- The 19th Construction Environment Management Best Practices Competition
- Received ministerial prize
ESH Management and Response to Climate Change
Environment
Greenhouse Gas(GHG)
| Classification | Unit | 2021 | 2022 | 2023 | |
|---|---|---|---|---|---|
| Total GHG emissions (Scope 1 + Scope 2) |
tCO₂-eq | 64,822 | 64,263 | 68,748 | |
| Direct emissions (Scope 1) | 24,553 | 20,368 | 21,389 | ||
| Indirect emissions (Scope 2) | 40,269 | 43,895 | 47,359 | ||
| GHG emission intensity (based on nonconsolidated sales1) | tCO₂-eq/ KRW 100 million |
1.24 | 1.06 | 0.98 | |
| Other indirect emissions (Scope 3)2) | tCO₂-eq | 3,912,742 | 4,236,881 | 7,446,486 | |
| Reduction of GHG emissions3) | Clean Development Mechanism (CDM)-related emission reduction |
354,382 | 293,153 | Certification delayed4) |
|
| External emission reduction |
344,250 | 287,290 | |||
1) GHG emission intensity is calculated based on nonconsolidated sales, which is based on the current three business divisions (Global·E&C·Momentum).
2) Scope 3 emissions data in 2020 was marked as not applicable due to the unavailability of excluding Defense Division data before the business reorganization.
3) CDM related emission reduction and external emission reduction are based on the year when Hanwha Corporation obtained a KOC (Korea Offset Credits) certificate.
4) Following the Paris Climate Agreement coming into effect in 2021, transitioning CDM activities to SDM, certification for carbon reduction is delayed (KOC-certified reduction figure unavailable).
Energy
| Classification | Unit | 2021 | 2022 | 2023 | |
|---|---|---|---|---|---|
| Total energy consumption1) | TJ | 800 | 912 | 1,020 | |
| Non-renewable energy consumption | Direct energy consumption | 201 | 212 | 199 | |
| Indirect energy consumption | 766 | 912 | 990 | ||
| Renewable energy consumption2) | Total consumption | MWh | 18.25 | 18.25 | 18.25 |
| Consumption intensity (based on nonconsolidated sales3) |
TJ/ KRW 100 million |
0.01536 | 0.01507 | 0.01461 | |
1) (Total energy consumption) = (Non-renewable direct energy consumption) + (Non-renewable indirect energy consumption) + (Renewable energy consumption) - (Energy sold)
2) Self-generation through PV generation
3) Consumption intensity is calculated based on nonconsolidated sales, which is based on the current business divisions(Global·E&C·Momentum).
Air Pollutant Emission Concentration1)
| Classification | Unit | 2021 | 2022 | 2023 |
|---|---|---|---|---|
| Nitrogen oxide (NOx) emissions | Ton | 5.04 | 8.44 | 13.95 |
| Sulfur oxide (SOx) emissions | 0.01 | 0.00 | 0.47 | |
| Dust | 1.62 | 1.26 | 4.41 |
1) ‘Air pollutants’ only applies to Global Division.
Water Pollutants1)
| Classification | Unit | 2021 | 2022 | 2023 |
|---|---|---|---|---|
| Total Organic Carbon (TOC) | Ton | 0.46 | 0.10 | 0.13 |
| Biological Oxygen Demand (BOD) | 0.44 | 0.50 | 0.04 | |
| Suspended Solids (SS) | 0.77 | 1.19 | 0.12 |
1) ‘Water Pollutants’ only applies to Global Division.
Water and Wastewater
| Classification | Unit | 2021 | 2022 | 2023 | |
|---|---|---|---|---|---|
| Water consumption1) | Total water consumption | Ton | 756,399 | 1,053,328 | 905,885 |
| Groundwater | 193,664 | 210,609 | 208,572 | ||
| Third-party water2) | 562,735 | 842,719 | 697,313 | ||
| Amount of wastewater released | 50,270 | 50,447 | 74,746 | ||
| Amount of wastewater consigned | 2,725 | 2,920 | 2,484 | ||
1) Data related to water withdrawal has been managed since 2023.
Water consumption in 2020 is the combined amount of two divisions(Global·Momentum) and water consumption in 2021-2023 is the combined amount of three divisions(Global·E&C·Momentum).
2) Third party water : Water from municipal water suppliers and wastewater treatment plants, public or private utilities and other organizations involved in the provision, transportation, treatment or use of water and wastewater (ex: public water supply).
Hazardous Chemical Substances1)
| Classification | Unit | 2021 | 2022 | 2023 |
|---|---|---|---|---|
| Amount of hazardous chemical substances used | Ton | 149,638 | 202,228 | 316,758 |
1) ‘Hazardous Chemical Substances’ only applies to Global Division
Waste
| Classification | Unit | 2021 | 2022 | 2023 | |
|---|---|---|---|---|---|
| Total waste generation | Ton | 288,913.5 | 424,690.6 | 474,771.3 | |
| General wast | 1,192.4 | 964.2 | 5,325.4 | ||
| Specified waste | 73.0 | 123.1 | 426.6 | ||
| Construction waste | 287,648.1 | 423,603.3 | 469,019.3 | ||
| Amount of recycled waste | 9,299.6 | 13,261.0 | 472,662.1 | ||
| Cost for waste disposal1) | Ton/KRW 1 million | 5.55 | 7.02 | 6.80 | |
1) Intensity of generated waste is calculated based on nonconsolidated sales, which is based on the current business divisions(Global·E&C·Momentum).
Environmental Training and Education
| Classification | Unit | 2021 | 2022 | 2023 |
|---|---|---|---|---|
| Total hours of environmental training and education | Hours | 1,450 | 4,810 | 8,047 |
| Number of attendees | Persons | 461 | 697 | 3,301 |
Environmental Investments and Expenditures1)
| Classification | Unit | 2021 | 2022 | 2023 |
|---|---|---|---|---|
| Environmental investments | KRW 100 million | 10 | 13 | 16 |
| Environmental expenditures | 135 | 191 | 211 |
1) Environmental investments and expenditures in 2022 include E&C Division data and exclude Defense Division data due to the business reorganization.
Environmental Regulations1)
| Classification | Unit | 2021 | 2022 | 2023 |
|---|---|---|---|---|
| umber of violations of environmental regulations | Cases | 0 | 1 | 1 |
| Penalty and fine for noncompliance with environmental regulations | KRW | 0 | 3,000,000 | 1,500,000 |
1) The number of violations of environmental regulations and fines in 2022 are based on the business reports, which includes the Defense Division.
Safety and Health
Occupational Accidents
| Classification | Unit | 2021 | 2022 | 2023 | |
|---|---|---|---|---|---|
| Occupational accident rate1) | Direct employees | % | 0 | 0.02 | 0.02 |
| Contractors | 1.43 | 1.49 | 1.83 | ||
| Number of serious accidents2) (Fatalities excluded) | Direct employees | Cases | N/A | 0 | 0 |
| Contractors | N/A | 0 | 0 | ||
| Lost Time Injury Rate (LTIR)3) | Direct employees | - | 0 | 0.02 | 0.04 |
| Contractors | 0.91 | 1.20 | 1.51 | ||
| Occupational Illness Frequency Rate (OIFR)4) | Direct employees | - | 0 | 0 | 0 |
| Contractors | 0.22 | 0.08 | 0.11 | ||
| Total Recordable Incident Rate(TRIR)5) | Direct employees | - | 0 | 0.02 | 0.02 |
| Contractors | 1.16 | 1.20 | 1.50 | ||
1) Occupational accident rate = (Number of victims from occupational accidents / Number of workers) * 100
2) Serious accidents subject to application of Serious Accident Punishment Act
3) LTIR = (Number of lost time injuries / Total hours worked) * 200,000 hours
4) OIFR = (Number of occupational diseases / Total hours worked) * 200,000 hours
5) TRIR = (Number of work-related incidents / Total hours worked) * 200,000 hours